Analysis of Islip Primary Radar for TWA 800
Proof that the CIA Video Discounting
Eyewitnesses is a Fraud
Radar Evidence of a Missile
Strike
December 12, 1999
Introduction
In early 1998 ARAP obtained a copy of the Debris Field TAGS
database that was leaked to outside investigators by someone
inside the investigation who was concerned that information was being changed
to fit the NTSB's pet mechanical failure theory. Each part in the
database was located by its GPS position, which gave an accurate fix of
its location. The major parts in the database were plotted on a chart
according to their coordinates to create a graphic view of the Debris
Field (pdf). This database was published in ARAP's Interim
Report in July 1998 and remains today the only publicly available documentation
of the debris location.
In December 1997 the NTSB produced its report which contained radar
return graphics in Exhibit 13A. These graphics were plotted with
respect to the distance from the Islip radar beacon. Since the debris
field TAGS database was created using Latitude and Longitude it was difficult
for the lay person to match the graphics with the debris field database.
In addition, the graphics were produced as a composite of several radars
over a twenty minute period. This resulted in a radar graph that
was so cluttered as to be meaningless. We were, however, able
to determine that there was an unidentified "30
knot track (pdf)" within 2.7 miles of the last transponder position
of Flight 800. Retired FBI Deputy Director James Kalstrom later admitted
that the FBI had not identified this boat which sped away from the crash
site at over 30 knots. [Letter
from FBI, see Question 2] [Audio
tape of Kalstrom]
In August, 1999, through the Freedom of Information Act, the Flight
800 Independent Researchers Organization (FIRO) obtained the tabular
data (1mb zip) used by the NTSB in creating Exhibit 13A. This
data represents the actual radar data received from all radars.
The graphics used in this analysis plot the tabular data using distance
from the Islip ASR-8 radar. This graphic was then overlaid on the
Latitude and Longitude plot of the Debris Field. The plots were lined
up using the last known transponder position of Flight 800 which is known
by both its distance from Islip and its Latitude and Longitude. The
scales were adjusted accordingly to provide 1 nautical mile equivalents.
Our analysis of this data follows:
Radar Tracks within
3 Nautical Miles of Flight 800
The composite radar graphic
(pdf) (gif) shows
that five key radar targets were identified within a 3 nautical mile radius
of Flight 800 when its transponder failed after 20:31:12. The three
airborne radar targets were: Flight 800, USAir Flight 217, a Navy
P-3 submarine hunter. The two surface targets included an unidentified
boat
2.9
nautical miles northeast of Flight 800, and another unidentified boat 2.7
nautical miles away captured on radar traveling away from the crash site
at over 30 knots. The NTSB named this radar target the "30
Knot Track".
USAir Flight 217 crossed Flight 800's path heading NNE about 24 seconds
after Flight 800 passed. Flight 800 was at 13,500 ft. and climbing.
USAir217 was above at 21,500 ft. When Flight 800's transponder stopped
sending data, it was approximately 2 miles ahead, one mile to the right
and 8,000 below USAir217. At approximately that same time, a NAVY
P-3 was passing below USAir217. At no time did the P-3 cross Flight
800's path.
The Islip primary radar is the closest to Flight 800 and provides the
most
detail to use in tracking the falling debris. Primary radar works
by the radar antenna bouncing a signal off the distant object and timing
the return reflection. The Islip radar rotates with a sweep period
of 4.69 seconds, therefore any target identified by the radar will only
show up every 4.69 seconds. This is a line-of-sight radar.
As a result, it is theoretically possible for some objects to be blocked
on any given radar pass because closer objects obscure the radar reflection.
This is particularly true of boats since all boats are by definition at
sea level, whereas airplanes fly at various altitudes. In the attached
plot (gif), (pdf)
each radar track is located by its distance from Islip at the time of the
radar return signal as recorded by the Islip radar.
Secondary Radar works with an aircraft's Transponder. The transponder
receives an inquiry from the secondary radar beacon and sends a response
with its altitude and identification. The radar determines the distance
by the same method as the Primary Radar by timing the return signal and
determining the distance from the radar beacon. Flight 800's transponder
responded to secondary radar inquiries until the loss of power. The
plots discussed here are a combination of Primary and Secondary radars
from Islip.
Flight 800's Transponder failed after the 20:31:12 sweep of Islip's
radar. From that point on, only primary radar was available to track
the aircraft and large pieces of debris after the explosion. The
primary radar records any reflected signal but does not have an altitude
component, therefore, we have the ability to determine distance and azimuth
from the radar but not the altitude of any object. The Islip radar
scans any given spot every 4.69 seconds. On the attached plot we
have identified each pass of the radar with a circled number. In
the following discussion we will refer to each successive radar reflection
as a Radar Sweep. Each Radar Sweep (RS) after the last transponder
return is identified by number starting with RS #1, the next Radar Sweep,
4.69 seconds later is RS #2, and so on. Multiple objects recorded
during the same time period will have the same number.
There were three primary radars that picked up Flight 800's path after
the on board loss of power to the transponder. The three radars were
from Islip, JFK and HPN. The track of Flight 800 shown during the
first 8 primary returns is a composite of ISP and JFK radar signals.
All other radar hits are from the Islip Primary radar.
Debris Pattern
The path of the main fuselage and wings of flight 800 is clear through
radar sweep 8 when it disappears from radar. There are multiple hits
at each sweep of the radar due to debris from the initial explosion.
There are four main areas of debris.
The first is from the initial explosion (orange debris
field), which happened after 20:31:12, but before 20:31:16.7.
This explosion ejected several pieces of debris at high velocity, at right
angles, which show up in radar sweeps 1 and 2. Some of the parts
were blown as far as 3,200-ft. by Sweep 2, in less than 9.4 seconds but
more than 4.69 seconds. By carefully measuring the course of the ejected
material and back tracking to its intersection with the aircraft's track,
the time of the explosive event can be estimated at 31:13.8. The
lead ejecta therefore covered 3,200 ft. in 7 seconds.
The second area of debris is from the separation of the nose section
( red debris field).
It appears to have separated from the aircraft at approximately Sweep 2,
9-10 seconds after the last transponder return.
The third area of debris are a cluster of hits as the nose section falls
(yellow debris field) from 13,750 ft. These continued to show up
sporadically on the radar through radar Sweep 20, or approximately 94 seconds
after the initial explosion. There is a significant anomaly in this
debris field as the radar picked up an object on radar sweep 1 that was
over 1.5 nautical miles from the aircraft's path in 4.69 seconds.
In addition, as the nose of the aircraft fell from 13,750 ft, because of
its size, it should have been visible on every sweep of the radar
and it was not. It appears that some data is missing from the radar data
file.
The last debris field (green debris
field) is around the location where the main fuselage, wings and engines
landed. There are hits on the main fuselage through Sweep 8 and then
there is not another radar Hit until Sweep 14 where wreckage is recorded
floating downwind through Sweep 20 at this location. There are also
parts of the CWT and other objects more than 1 mile downwind from the last
radar return and there is a large plume of debris emanating from Sweep
5. There appears to have been a significant final explosion between
Sweeps 5 and 6 because the main wreckage splits into two pieces and a great
deal of debris are blown downwind.
Radar Anomalies
All three radars,
Islip, JFK and HPN have some anomalies with respect to each other and with
respect to the aircraft's speed when calculated from one radar return to
the next. The three radars are all independent with JFK and ISP being
slightly out of synch (between .04 and .53 seconds) and HPN being a full
2 seconds ahead. The timing and angular differences make it difficult
to compare the three radars for positional accuracy because the aircraft
was traveling at 633 ft. sec. However, since ISP and JFK timing are
close, as little as .04 seconds, they can be compared to one another.
It should be noted here that this type of radar, because of beam width,
has a built in margin of error of hundreds of feet for any given Sweep,
however when averaged over several Sweeps, the accuracy increases.
For example, we calculated the position and speed of Flight 800 for 10
radar sweeps prior to the loss of the transponder. The speed varied
significantly from sweep to sweep, but over several sweeps the average
speed was similar to Flight 800's known speed prior to the initiating event.
All three radars show an increase in speed after the initial explosion
with two of them being significant, and JFK being slight. All three
radars show sweep 4 in approximately the same location providing some confidence
in its position. Although the speed of the aircraft shows a significant
increase between sweeps 1 and 2, the average speed of the aircraft during
the first 20 seconds is 338 knots or only 40 knots slower than the aircraft's
initial velocity of 370 knots. This is a relatively high velocity
because the radar doesn't see any vertical velocity component, up or down.
Analysis of the
Flight Path
The aircraft lost power to the transponder when the Initiating Event
(IE) occurred after 20:31:12 and before 31:16.7. It is clear from
the blowup of the flight
path that a large amount of debris is blown off the aircraft before Sweep
1 as there are two different radar reflections at that point. As
the main body of the aircraft continues forward, there is a cluster of
debris that continues to fall at this location through Sweep 20.
All of this material remains outside the official
debris field and was not recorded in the TAGS database. This
may be part of the 4 tons of the aircraft never "officially" recovered.
The earliest part that was found in the debris field database was CW-504.
You can see where CW-504 was recorded in the TAGS database. The "official"
debris was all located to the right or east of CW-504. However, this area
was specifically dredged by the FBI for over 6 months [see FBI
Covert Dredging Operation] and it is unlikely that these parts of the
aircraft were never found. If they were found, neither the NTSB nor
the FBI has ever acknowledged that there were any parts found to the west
of CW-504.
The NTSB has postulated that the nose separated from the aircraft in
approximately 4 -5 seconds after the initial explosion. The
location
of the nose section in the Debris Field supports this contention.
This means that the nose separated from the aircraft during the 20 second
period that the aircraft maintained an average speed of 338 knots.
During this period, if the aircraft had pitched up, as the CIA said, it
would have stalled and slowed as forward speed was traded for altitude.
On the contrary, the aircraft maintained significant speed until sweep
4. The loss of 40 knots airspeed would be expected due to the excessive
drag provided by the open fuselage.
The main wreckage moved slightly to the right between Sweeps 3 and 4.
After Sweep 4 the aircraft has slowed significantly. By Sweep 5 it
has turned back to the left and it's speed over the ground has slowed further.
It appears the final catastrophic explosion happened after Sweep 5, 23.5
seconds after the initial explosion. By Sweep 6 there are two pieces
of the
main wreckage and
the aircraft makes a sharp turn to the right. This is probably when
the left wing separated from the aircraft. The imbalance with only
the right wing attached would have caused a radical change in the aerodynamic
center of pressure. Acting on the ballistic mass and coupling with
a high shift in center of gravity would create exceptional rolling and
pitching moments. These gyrations were clearly seen by captain Adams,
eight miles east. The main aircraft wreckage only appears on radar
for another two Sweeps. It is lost completely from radar after Sweep
8, or 38.5 seconds after the last transponder return. Lighter debris
is later spotted drifting downwind at Sweep 14 and appears sporadically
until Sweep 20. The remains of the fuselage, wings and engines were
found in the debris field at precisely the location of Sweeps 7 & 8.
Therefore, it is unlikely that these parts of the aircraft were in the
air beyond Sweep 8, or 38.5 seconds after the last transponder return.
The items seen in Sweeps 14-20 are lighter debris floating downward and
downwind.
Evidence of a
Missile
A Sweep by Sweep analysis of the radar data clearly depicts a plume
of very high velocity metal exploding out of the aircraft's right side
at approximately 20:31:13. The lead ejecta almost certainly has to
be a missile body!
With the aircraft on a heading of 071 degrees True, this radar contact
separated laterally from the aircraft track on a ballistic
trajectory of 190 degrees True, traveling about 3,200 feet in less than
7 seconds. This 119 degree change of direction and high velocity
could not possibly have been the result of a Center Wing Tank explosion.
This is not theory or speculation, but hard physical evidence.
It takes almost 2 seconds for a bullet fired from a military sniper rifle
to travel that distance. Only a missile body, with it's hundreds
of thousands of foot pounds (ft/lbs)* of kinetic energy would have the
inertia
to perform this way on radar. It only takes 6,000 ft/lbs of energy
for a 50 caliber heavy machine gun bullet to punch through 3/8 inch thick
steel plate. Boeing 747's are constructed of various aluminum alloys
and rarely in thickness' exceeding 1/2 inch.
With this much energy, the missile body would slice through the aircraft
"like a bullet through a tin can", just as I stated in my April 24, 1997
letter to the Wall Street Journal, in response to Chairman Hall's "It wasn't
a missile" letter to the same paper. It is startling to note also
that the trajectory of the ejecta (missile body & other parts) is on
a direct line from
an unidentified boat, 2.9 nautical miles to the Northeast of Flight 800
when it exploded.
* [ 15lb missile body @ 1500 ft/sec, apply 1/2 MV squared = 524,720
ft/lbs of energy ]
Eyewitness Accounts
from USAir Flight 217
Navy Chief Petty Officer Dwight Brumley was on US Air Flight 217 from
Charlotte, North Carolina to Providence, Rhode Island. Mr.
Brumley was seated in seat 5F at the window on the right side of the aircraft.
He saw a streak of light
overtaking his aircraft from right to left. As he lost sight
of the streak he saw a large fireball erupt going from his left to his
right. He then lost sight of the fireball as it disappeared underneath
the right wing.
This witness disproves the CIA / NTSB theory that the streak seen by
eyewitnesses was the aircraft climbing and burning after an initial explosion.
He clearly saw a streak coming from his right to left and TWA Flight 800
was going from his left to his right.
Eyewitness Accounts
from Boats in the Area
We have access to over 130 eyewitnesses who surrounded the crash.
Most of these eyewitnesses saw a streak rising from at or near the surface
and intersecting with Flight 800. The NTSB and FBI claim there were
no witnesses closer than 8-10 miles from the explosion yet we have interviewed
at least 8 eye witnesses who were within 8 miles of the crash. None
of them support the CIA / NTSB version of events.
Triangulation
of Eyewitness Sightings
Click here for an updated version of the Eyewitness
Triangulation (pdf). Gif
Version.
NTSB Eyewitness
Group Factual Report - Exhibit 4A
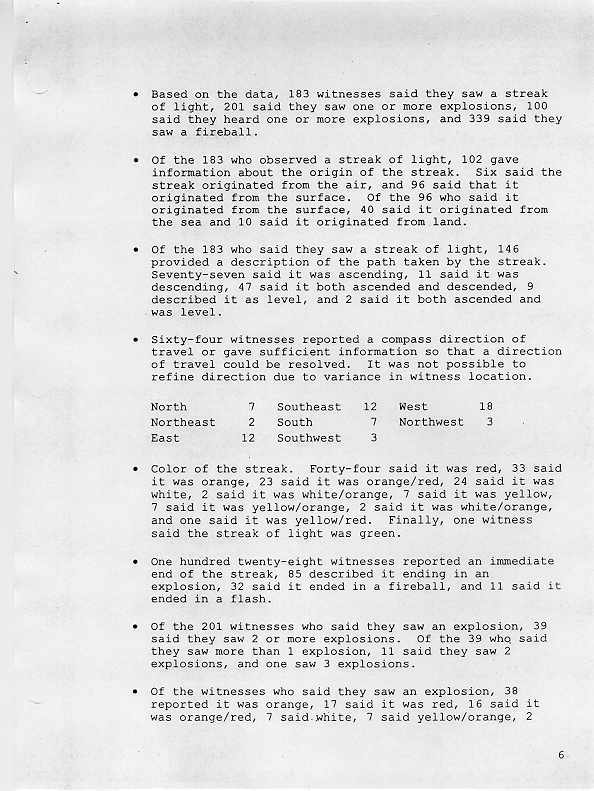
Relevant data from the Eyewitness Group Factual Report:
-
Based on the data, 183 witnesses said they saw a streak of light, 201 said
they saw one or more explosions, 100 said they heard one or more explosions,
and 339 said they saw a fireball.
-
Of the 183 who observed a streak of light, 102 gave information about the
origin of the streak. Six said the streak originated from the air,
and 96 said that it originated from the surface. Of the 96 who said
it originated from the surface, 40 said it originated from the sea and
10 said it originated from land.
-
One hundred and twenty-eight witnesses reported an immediate end to the
streak, 85 described it ending in an explosion, 32 said it ended in a fireball,
and 11 said it ended in a flash.
NTSB
Eyewitness Group Factual Report Exhibit 4A - Full Report
Page 6 - Summary only
Baltimore Public
Hearing Transcript - 12-8-97, Transcript page 98
Witness Clark:
"Some of the timing of the events, when the nose first
came off we
believe the aft section pitched up and slowed down a dramatic
amount
down to well in the 150-naut range, and then as it pitched over
and
rolled over and started down we think these speeds picked up
well over
two or three hundred nauts."
This statement is completely at odds with the radar data that shows the
aircraft maintaining significant speed until Sweep 4 with a dramatic slowdown
in ground speed after Sweep 5 when the massive explosion took place.
The NTSB was certainly aware of the radar data at the time of the Public
Hearing, a year and a half after the crash. How could they have made
such a statement and why? Was it perjury or was it simply "Theory
first, facts be damned".
Analysis of the
CIA & NTSB Video Depictions of the Flight Path
At a press conference (video
1.4 mb) on November 11, 1997 when the FBI concluded their investigation,
they played a video animation of the flight path produced by the CIA.
The purpose of this video was to attempt to explain what the 96 eyewitnesses
saw who believed they saw a "streak" or "flare" rise from the surface and
strike Flight 800. It was also used as justification for discounting
the Missile Theory and giving the FBI a reason to close their investigation.
This animation showed the 747 with the nose coming off after the center
wing tank exploded and then somehow climbing 3,000 ft streaming burning
debris in a "Zoom Climb". They explained that what the eyewitnesses
saw was the "aircraft in various stages of crippled flight".
There were so many objections to this animation, later called the CIA
Cartoon (video 3.89 mb), by aviation professionals that it was not shown at
the Baltimore public hearings later in December, but was instead replaced
by a version from the NTSB (video
4.3 mb) which showed only a 1,500 ft. climb, but still claiming that
this is what the eyewitnesses saw. The NTSB also produced a video
of the view from the beach
(video 1.5 mb) which shows the aircraft in the air until well after 20:32:06, a full 17
seconds and 3 radar sweeps after Flight 800 is lost on radar. Once
again, the video matches their theory, but not the facts.
Boeing was so taken aback by these videos that they issued a press
release claiming that Boeing is "not aware of the data that was used
to produce the video". This was an extraordinary move for Boeing because
they were in effect saying "Don't look at us, we have no idea how they
came up with this crazy theory".
The public has no way of determining if this "Zoom Climb" theory has
any validity in fact or was supported by other information because the
primary radar data has no altitude component. Therefore, we know
where the aircraft was every 4.69 seconds, but not how high. Fortunately,
close analysis of the data does allow us to determine if the "Zoom Climb"
theory makes any sense. This analysis shows that that theory is a
complete fabrication.
Zoom Climb. A zoom
climb (gif) is a maneuver where an aircraft can climb without adding
any additional thrust or power. It is accomplished by the aircraft
trading forward or horizontal velocity for vertical velocity. The
action is much like a roller coaster which can climb the next hill because
it uses its forward speed to give it upward speed. As it goes up,
it slows down until it almost stops before making it over the top.
In this instance the horizontal velocity reaches almost zero although it
is going up very quickly. The same phenomenon happens with aircraft.
The captain can pull up and gain altitude at the expense of horizontal
speed. When you watch a barnstorming act the aircraft is seen traveling
horizontally at a couple hundred miles an hour and pulls up into a climb
that is almost straight up. When this happens, the horizontal speed
reaches zero. This is a long-winded explanation of a zoom climb,
but it is necessary to understand why the CIA/NTSB theory is a fraud.
Ballistic Fall. The captain
of the NOAA research ship Rude entered Flight 800's last secondary radar
position, speed, heading and gross weight into his computer and it predicted
the landing point by calculating a ballistic fall. He went to that
spot and immediately found the main wreckage including the fuselage, wings
and engines.
We used the NTSB radar data to simulate the expected
trajectory (pdf) for Flight 800 as it fell in a ballistic arc from
the initial explosion point to the spot where it landed in the debris field.
We know from the radar data how far the aircraft traveled and its heading
between radar Sweeps. The only thing not known is the altitude.
We simulated the ballistic fall by using the acceleration of gravity with
an assumed terminal velocity of 450 ft/sec. As you can see from the
graph, the aircraft impacts the water just after the last radar return
was received by the Islip radar. [Table
showing rate of fall].
NTSB Zoom Climb. Although
the radar data released by the NTSB has no altitude information, we can
use it to determine if a zoom climb occurred. The radar data shows
the aircraft's position in relation to the Islip radar beacon every 4.69
seconds. Using this data you can calculate the aircraft's horizontal
speed between each radar return. If the aircraft did a "zoom climb"
you would expect to see a significant reduction in ground speed (horizontal
velocity). This is especially true the more steeply the aircraft
climbs.
The NTSB video shows the initial explosion at 20:31:12, the nose separating
at 20:31:16 and the aircraft beginning its zoom climb at 20:31:20.
It reaches the peak of its 1,500 ft climb at 20:31:28 or 8 seconds later.
This is a rate of climb of 187 ft./sec. or 11,250 feet per minute.
Considering that a fully loaded 474-100 with full power climbs at less
than 4,000 feet per minute, it is hardly likely that a crippled 747, with
extreme drag due to the loss of the nose, could climb at nearly 3 times
the normal rate with the engines at idle, which is what Boeing says would
happen with the loss of the nose section.
In addition, with the aircraft reaching its peak altitude of 15,200
ft. it would take the
aircraft another 40 seconds to fall from 15,200 feet. However,
there is a significant problem with this. The aircraft is only visible
on radar for another 20 seconds. It disappears from radar after Sweep
8. It should have been visible through Sweep 12. It was not.
Lastly, if there was a zoom climb, the aircraft's forward velocity would
have slowed significantly between 20:31:20 and 20:31:28. There is
no evidence of a significant loss of horizontal speed during this time
period. In fact, two of the three radars tracking the flight path
show the aircraft speeding up. The third shows it slowing slightly.
In all cases it appears to have maintained a forward velocity of over 300
knots during this period. Using a physics calculation for the loss
of forward velocity in a zoom climb, you would expect the forward speed
to have dropped to around 200 knots. The radar data does not support
this. Therefore the "zoom climb" could not have happened.
[Table showing rate
of fall]
CIA Zoom Climb. The
CIA video was even more ridiculous in that it showed the aircraft climbing
to 17,000 ft. You still have the same problem of the aircraft not
being capable of climbing 3 times faster than normal. You also have
the problem that it would take much longer to get to 17,000, even at this
absurd rate of climb. That brings us to the biggest problem with
the CIA scenario and that is the time it would take to hit the water.
It would take at least 54 seconds after reaching 17,000 for the aircraft
to hit the water assuming it reaches a terminal velocity of 450 ft/sec.
It is only visible on radar for another 20 seconds. Where was the
aircraft for those extra 34 seconds. There are two choices.
It was either swallowed up by the Northern Bermuda Triangle or it was already
in the water because there never was a "zoom climb". Lastly, there
is still the problem of the aircraft maintaining too much speed for a zoom
climb to have happened. [Table
showing rate of fall]
The CIA video also contains a number of blatant lies which were necessary
to make their case:
-
They said the nearest eyewitness was 8.8 miles away, while a number of
witnesses were in boats within 3-5 miles and the best eyewitness was on
USAir 217, 8,000 ft. above.
-
They said the eyewitnesses all heard the explosion first then looked up,
therefore, because sound travels slowly, no one could have seen the initial
explosion. This is refuted directly by the Eyewitness Factual Report
4A which shows that 183 people saw a streak, but only 100 said they heard
an explosion. The report contained no information about whether or
not these 100 people heard something before or after they saw the streak.
Yet the CIA, without ever talking to an eyewitness, claims that everyone
who saw the streak, first were drawn to the scene by the sound. This
is completely and patently false and only used to discredit the eyewitnesses.
-
The CIA video claimed that the aircraft hit the water 49 seconds after
the initial explosion, yet it was lost on radar after 38 seconds.
Furthermore, a recreation of their video shows that if the aircraft actually
reached 17,000 ft, it could not have hit the water before 70 seconds after
the explosion.
-
The CIA video claimed that the massive explosion which occurred when the
left wing separated happened 42 seconds after the initial explosion, yet
the radar shows the left wing has separated before Radar Sweep 6, 28 seconds
after the initial explosion.
-
The CIA video misquotes witness Brumley as saying the streak he saw was
heading East Northeast, when, in fact, he stated that the streak was heading
North Northeast.
-
The CIA claims that the initial explosion was not seen by any known eyewitness,
yet there are dozens of eyewitnesses who saw the entire event.
-
The CIA claims that anyone hearing a loud sound and seeing the debris falling
must have heard the initial explosion. They ignore the fact that
if it was a missile traveling at Mach 2, there would have been a sonic
boom prior to the initial explosion.
-
Finally, they give as evidence that there was no missile the fact that
no one who saw the streak saw the aircraft before the explosion, therefore
the streak must have been the aircraft. This ignores the physical
and optical phenomenon that a person's eye is drawn to the brightest and
fastest object visible to the exclusion of any other visible objects.
Finally, in both scenarios, the zoom climb, when
viewed
in perspective (gif), (
pdf)
from 5-10 miles away, would hardly appear to be a "streaking rocket" or
a "flare" to the viewer [
NTSB
perspective (gif)]. The gain in altitude was insignificant from
this distance with only a 9% gain in the NTSB version and a 21% gain in
the CIA version. It would hardly appear as a streak originating from
the surface as 96 people told the FBI.
In summary, there are four PROOFS that the CIA/NTSB theory that the
Eyewitnesses saw the "aircraft in various stages of crippled flight", is
a fraud. They are:
-
The rate of climb was improbable if not impossible.
-
The fall time would have taken too long - the aircraft disappears from
radar too soon.
-
The zoom climb should have significantly slowed the aircraft - it did not.
-
The perspective of most eyewitnesses would have minimized the perception
of the aircraft streaking.
So! If the eyewitnesses did not see the aircraft climbing and burning,
what did they see???
The eyewitnesses have a right to be heard and they want to be heard.
There is also significant, factual radar evidence that shows what
could only be a missile body exiting the aircraft at high velocity.
The time has come for a full congressional hearing where the eyewitnesses
can tell their story and the FBI and NTSB can explain how they have ignored
such hard forensic evidence.
© 1999 William S. Donaldson III. All
rights reserved